


The Monopoly Firm: Part 2
Costs and profits


In our last article we went over the relationship between demand and marginal revenue for a non price-discriminating monopoly and we saw how the MR line is below the demand curve. Continuing from there, it’s time to look at a monopoly’s cost curves and how this can be used to make economic profit.
To figure out what a monopoly ought to produce, we must first figure out the costs of their production.

Here we’ve expanded the same table from our Marginalism and the Firm article so that we know the...
variable costs (VC)
total costs (TC)
the marginal cost (MC) and average total cost (ATC)
of making up to 10 coffee cups. The key figures here are the MC and ATC, as plotted below:
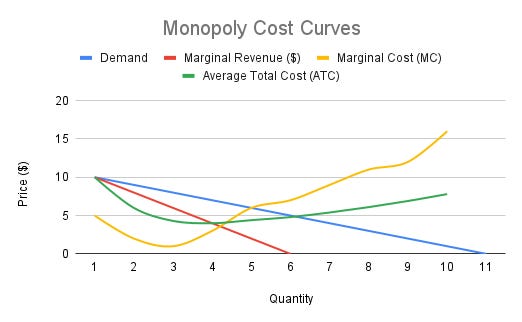
Both the MC and ATC are exactly the same as in perfect competition: the former goes down and up, and the latter goes down, hits a minimum point, and then goes back up. Because of this, the same reasoning also applies: always produce where MR = MC. As long as your incremental revenue for every unit is higher than the incremental cost for every unit, you want to produce more and more until MR = MC.
In our specific case, it means producing no more than 4 units at $7 each. Wait, where did we get $7 from? The demand curve - that shows the price point at which people are able and willing to pay for the coffee. In this case, if we sell each cup at $7, we will sell 4 cups of coffee, meaning 4 people are able and willing to pay for it.
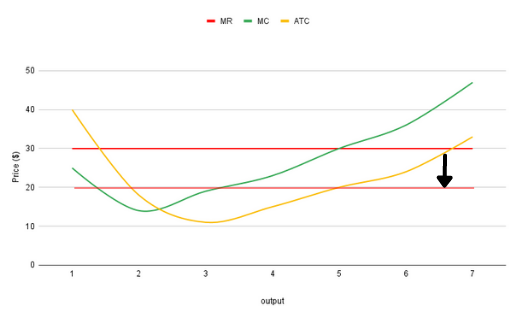
Now here’s the monopolistic catch: a perfectly competitive firm would produce where MR meets MC. Observing the graph below, anything beyond the green box is when operations become marginally unprofitable, since that’s when your MC exceeds your MR. Under perfect competition, MR is the demand curve, and so you would produce where MC meets the demand curve. But the monopoly’s MR curve is less than the demand curve. Thus, the monopoly produces at a marginal cost that’s less than the demand (the price people are willing and able to pay).

This gap we see between marginal revenue and demand is only possible under monopolies as their MR is less than the demand, and it’s referred to as deadweight loss (more on this in our next article).
But back to our original question - figuring out what the monopoly ought to produce, assuming they want to profit. Just like competitive firms, we need to look at the ATC (average total cost) to determine whether or not a profit is being made. Referring to the Monopoly Cost Curves chart from earlier, we can see that selling 4 units at $7 each will yield an economic profit. Each unit at that price point is being sold for $7, and we only have an ATC of $4 to deal with, meaning we marginally profit with $3.

The big takeaway here is that because a monopoly’s MR curve is below the demand curve, both the MC and the ATC will intersect the MR at a quantity where the price (as denoted on the demand curve) is greater than the MC.
One final advantage that the monopoly firm has over competitive rates with regards to profit margins (the black box above) is that it remains relatively unchanged due to the high barriers to entry. In a perfectly competitive market, firms profiting inadvertently invites competition: it tells entrepreneurs that there’s money to be made in the industry.
When more firms enter the market, this affects the supply curve. Specifically, it shifts to the right:

As seen in the graph above, P1 is the new, lowered price. A lower price means a lower marginal revenue. A lower MR (in a perfectly competitive market) means that firms are going to produce less than what they would have had the supply curve shift not taken place. Instead, the reason why quantity demanded often increases is because the production is spread out among multiple competing firms. But each individual firm is going to produce less had the supply curve shift not taken place. Why are firms going to produce less? Remember the golden profit rule: always produce where MR=MC.
If the MR “bar” is being lowered, that means you’re not only going to produce less and less, but it also means your profit margins are shrinking. As the MR is being lowered, it’s also getting closer to the MC, thus squeezing the profit margin.
But monopolies don’t face this threat: one of the key characteristics of a monopolistic market is that there are high barriers, sometimes insurmountable ones. This means that even if the monopoly is profiting in their respective industry the profit margin won’t be affected by a decreasing MR curve.
We mentioned deadweight loss earlier in this article and how it’s an inherent inefficiency to monopolies. This is a key reason economists often warn about the dangers of monopolies and why even if they don’t jack up prices, they can still be harmful to society. But how exactly does deadweight loss come about and what can governments do about it? Stay tuned to find out.
‘Till next time,
SoBasically