


Marginal Revenue and Profits
How entrepreneurs make money


Consider this the grande finale of our unofficial “Marginalism” series. Now that we’ve reviewed marginalism in the abstract and how it applies to a firm’s output and cost, it’s time for the finishing touches: marginal revenue and profit.
Revenue:
the income a business generates, plain and simple. If you sell 10 cups of coffee, each for $5, you generate $50 in revenue. Ergo, marginal revenue entails the revenue you receive from selling an additional unit of whatever it is you're selling.
Profit:
the financial benefit realized from business activity, calculated by subtracting costs from the revenue. You generated $50 in revenue from selling cups of coffee, but the costs of making these cups of coffee were, say, $32 in total. Thus, you made $18 in profit. Therefore, marginal profit entails the profit you receive from selling an additional unit of whatever is you’re selling.
Whether or not your revenue turns into profit (meaning you receive more than you put in) depends entirely on your cost: the revenue must be higher than the cost in order to yield profit. Looking at the situation from a marginalist perspective, a profit-seeking business owner ought to keep producing as long as the marginal revenue exceeds the marginal cost. From this, we have a simple yet important microeconomic equation:

This is the profit-maximizing rule and it represents what has just been explained: always produce as long as the marginal revenue exceeds the marginal cost. If you do that, you profit. Here’s how we would plot this onto a graph:

This is the marginal cost from our last article’s coffee example. We’ve isolated it from the average variable cost (AVC), average fixed cost (AFC), and average total cost (ATC) just to make it easier to see.

Here we have the marginal revenue, assuming each cup of coffee sells for $5 and that the price remains constant; each additional coffee brings us $5. Now combining the two…

This graph allows us to figure out how many units we should make so that we maximize output and maintain profit. In this particular case, it would be producing 4 cups of coffee, bringing in $5 of marginal revenue but marginally costing only $3, and so we make a $2 marginal profit. The reason we don’t want to produce a 5th cup is because that would cost an additional $6 but only bring in $5 in marginal revenue, resulting in us operating at a marginal loss.
Notice how we calculate the optimal output, we didn’t need the average total cost (ATC). No matter where the ATC, you’re still going to produce MR=MC (or in our case, rounding down to the nearest integer). But you do need the ATC to calculate the profit, and this is when our graphs get a little more interesting.

The grey box is the total cost; ACT (4) x output (4), so $16. The blue box is the profit margin, and because it’s on the edge of both the revenue and the costs, that box is the biggest it can be - that is where profit is maximized. Graphs that depict a firm operating at a loss (meaning their cost is greater than their revenue) will look slightly different, but the general principle is the same:
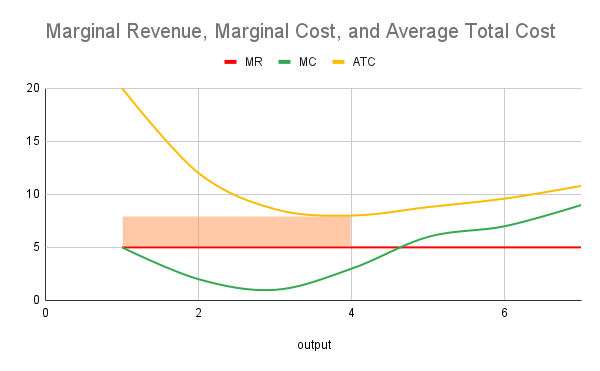
Here we’ve doubled our ATCs such that no matter how many units we produce, we’re always operating at a loss. This, of course, is not the ideal scenario as you’re putting in more money than is being received. But suppose you simply have to work with what you have and continue your business operations - what do you do?
The neat thing about the profit-maximizing rule is that it’s also the loss-minimizing rule. The orange box is where your losses will be minimized. Producing any more or any less will result in more losses. Just like our example where the ATC was below the MR, you always produce where MR=MC (or in our case, we rounded down to the nearest integer).
But certainly there are instances where we simply don’t produce right? Indeed there are: when your losses become really big, the most viable option would be to shut down and halt production. Keep in mind that this doesn't always mean leaving the market (where you sell off your assets), but rather that you’re taking a break so you can better incorporate the costs.
So at what point does it make sense to shut down and how do we figure that out? Here we throw in another variable: average variable cost (AVC)

This is known as the Shutdown Rule, and it states that a firm should cease production if the MR falls below the minimum AVC point (as demonstrated in the graph above). Why do we use the minimum AVC as the breaking point? Well remember the 3 kinds of costs:
Average total cost
Average variable cost
Average fixed cost
AFC is the difference between ATC and AVC - the space between the yellow and blue lines (since AFC + AVC = ATC, hence the name total cost). So if your revenue is above the AVC but below the ATC (that is, the red line being above the blue line and below the yellow line), you’re still paying off some of your fixed costs (the ones that exist independent of how many units you produce) despite still operating at a loss. But if your revenue is also below your AVC (meaning the red line is below both the blue and yellow lines), that means your fixed costs are also being neglected.
Since the MR dropped below the AVC, our losses are now greater than the fixed costs. But if we shut down entirely, we no longer have to pay for variable costs (since they exist insofar as production continues) and are instead just faced with fixed costs.
This is why we don’t necessarily shut down despite operating at a loss; if our MR exceeds the AVC, some of our fixed costs are still being paid. Shutting down means that we assume our fixed costs as our losses
To top it off, here’s the verbal guide, so to speak, to profit maximization:
Profit: revenue line above the ATC
Breaking even: total revenue = total costs, you’re making no profit
Loss: revenue line is below your ATC meaning you’re losing money, but at least your fixed costs are somewhat being covered
Shut down: revenue line has fallen below AVC, so now your fixed costs aren’t even being operated. Best to just close business for now